
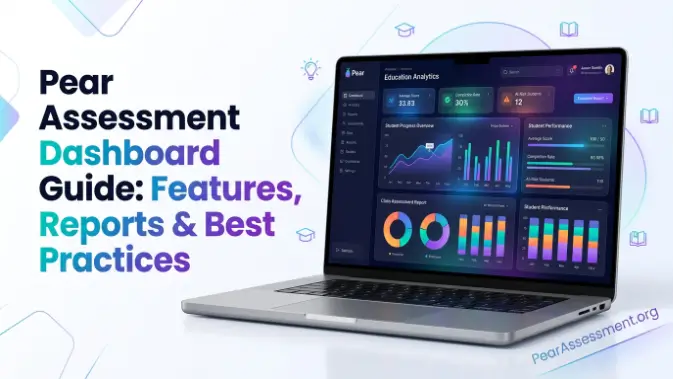
Welcome to Pear Assessment. The Pear Assessment Dashboard Guide helps educators use assessment data to strengthen instruction and improve student outcomes. It provides a centralized view of student performance, assessment analytics, and classroom results, making it easier to identify learning gaps, track progress, and make informed teaching decisions. Whether you’re new to Pear Assessment or improving your existing workflow, understanding the dashboard can save time and support effective data-driven teaching.
This guide covers how to access the dashboard, navigate its features, review performance reports, monitor learning progress, and use classroom analytics effectively. It also provides practical tips, common solutions, and best practices to help educators interpret assessment data confidently and use it to support student learning.
What Is the Pear Assessment Dashboard?
The Pear Assessment Dashboard Guide shows educators how to use the Pear Assessment Dashboard to review student performance, analyze assessment results, and monitor classroom progress. It brings reports, learning progress data, and assessment insights together in one place to support informed instructional decisions.
Overview of the Dashboard
The Pear Assessment Dashboard organizes assessment results into clear reports and visual summaries. It gives educators convenient access to assessment analytics, student scores, and overall class performance.
Teachers can examine performance reports, recognize learning gaps, and follow student progress without manually organizing assessment data. This makes data review more efficient and supports better instructional planning.
Who Should Use It?
The dashboard is useful for teachers, instructional coaches, school administrators, and district leaders who need to monitor student performance and assessment results. It provides relevant data for different educational roles and responsibilities.
Whether managing a single class or multiple groups, users can track learning progress, review results, and identify students who may require additional support. This helps educators make timely, data-informed decisions.
Key Benefits for Teachers and Schools
The dashboard makes assessment management easier by bringing classroom analytics and student data together in one location. Teachers can review results, recognize performance trends, and plan targeted instruction more efficiently.
Schools can use assessment analytics to monitor student progress, guide interventions, and support improved learning outcomes. Organized reports give educators useful insights for making confident, data-driven instructional decisions.
Read also: Best Pear Assessment Alternatives
How to Access the Pear Assessment Dashboard
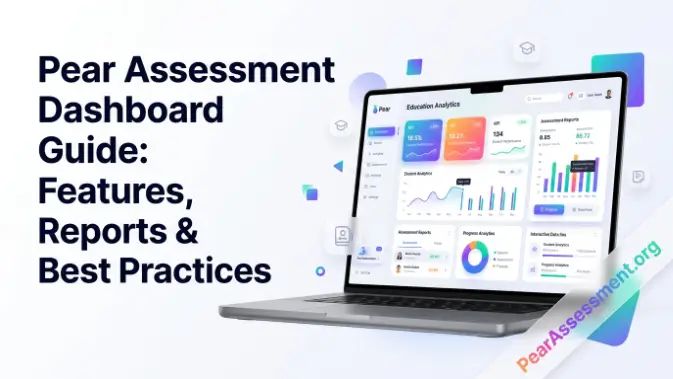
The Pear Assessment Dashboard Guide simplifies dashboard access for educators. Once signed in, educators can review assessment analytics, manage classes, access reports, and monitor student performance from a centralized dashboard.
Logging Into Your Account
Visit the Pear Assessment website and log in with your educator account credentials. Once authentication is complete, you will be taken directly to your dashboard.
From the dashboard, you can open performance reports, view recent assessments, and access classroom data. Saving the dashboard as a bookmark can make it easier to access during regular teaching tasks.
Dashboard Requirements
For smooth dashboard use, you need a reliable internet connection, a supported web browser, and an active Pear Assessment account. Keeping your browser and related software updated can also improve performance and security.
Your account should contain completed assessments so the system can generate student performance reports and learning progress insights. If assessment data is unavailable, some reporting features may have limited information.
Navigating the Main Interface
The dashboard is divided into organized sections such as Assessments, Classes, Reports, Analytics, and Settings. This structure makes it easier to locate assessment information and account options.
Use the navigation menu to move between classroom analytics, student results, and assessment summaries. Once familiar with the layout, educators can review important data more quickly and efficiently.
Understanding the Dashboard Layout
The Pear Assessment Dashboard Guide helps educators become familiar with the dashboard layout, providing quicker access to assessment analytics, student performance, and classroom reports. Understanding the location of each feature makes routine assessment management more efficient.
Home Screen Overview
The home screen offers an overview of recent assessments, active classes, and student activity. It allows educators to see important information and updates without opening several separate reports.
Teachers can review learning progress, recent submissions, and assessment summaries from a single location. This overview makes it easier to prioritize tasks and keep track of classroom performance.
Assessment Summary Cards
Assessment summary cards show important information for each assessment, such as completion status, average scores, and participation rates. These details give teachers a quick picture of class performance.
Teachers can use these cards to compare performance reports between assessments and recognize meaningful trends. Regularly checking the summaries can support quicker and more focused instructional planning.
Student Performance Panels
Student performance panels display individual and class results through charts, scores, and other summaries. This visual presentation makes student performance easier to review and interpret.
Teachers can examine assessment analytics to recognize learning gaps, follow student progress, and determine where additional support may be needed. Clear visual information helps simplify instructional decisions.
Navigation Menu
The navigation menu provides direct access to Assessments, Classes, Reports, Analytics, and Settings. Its structured design allows users to move between dashboard functions without unnecessary steps.
Using the menu effectively helps teachers locate classroom analytics, review reports, and manage assessments more efficiently. Familiarity with these options can streamline everyday assessment workflows.
How to View Student Assessment Reports
The Pear Assessment Dashboard Guide provides an organized way to review student performance through assessment reports. Educators can examine individual and class results, follow learning progress, and use assessment information to guide classroom instruction.
Student Assessment Reports
- Individual Student Reports: Review each student’s scores, responses, and performance reports to recognize strengths, weaknesses, and areas where additional learning support may be needed.
- Class Performance Reports: Examine overall class results through assessment analytics to measure achievement levels and identify learning gaps shared by multiple students.
- Assignment Results: Check completed assignments, submission status, average scores, and participation levels to understand student engagement and academic progress.
- Score Breakdown: Review question-level scores and classroom analytics to identify well-understood topics and concepts that may require further explanation or instruction.
Filtering and Organizing Assessment Data
The Pear Assessment Dashboard Guide provides useful filtering and organization tools that allow educators to examine student performance more efficiently. Teachers can filter information by class, date, or assessment and sort results to recognize trends, follow learning progress, compare outcomes, and make informed instructional decisions without manually reviewing every report.
Filter by Class
Use the class filter to show assessment information for a particular class. This allows teachers to concentrate on one group, examine individual results, and evaluate overall classroom achievement.
Filtering by class strengthens classroom analytics by making learning gaps, participation levels, and achievement patterns easier to identify. It can also support targeted lesson planning and interventions for specific classes.
Filter by Date
The date filter lets educators examine assessments from a particular day, week, month, or grading period. This provides a practical way to review recent activity and evaluate changes in student performance over time.
Comparing performance reports across dates can help teachers recognize improvement, assess instructional approaches, and determine whether students are progressing toward learning objectives.
Filter by Assessment
Choose an individual quiz, test, or assignment to examine its results separately. This focused view makes it easier to understand how students performed on a specific assessment.
Using assessment analytics for one assessment can reveal challenging questions, recurring misconceptions, and topics that may benefit from reteaching. It also provides a clearer view of assessment-specific performance.
Sorting Student Results
Student results can be sorted by score, name, completion status, submission date, or performance level to make reports easier to manage. This helps educators locate specific information with less effort.
Sorting student performance data can highlight high-performing students, learners who may need intervention, late submissions, and broader class trends. Well-organized results make instructional planning more efficient.
Using Dashboard Analytics to Improve Learning
The Pear Assessment Dashboard Guide enables educators to use assessment analytics to strengthen instruction and support student achievement. By examining assessment data, teachers can identify learning gaps, monitor student performance, compare results, and make informed choices that encourage continued academic progress.
Identifying Learning Gaps
Dashboard analytics can show topics where students experience difficulty through question-level and assessment-level results. This allows teachers to recognize concepts that may require additional teaching or practice.
Reviewing performance reports helps educators organize students according to their learning needs and provide targeted support. Addressing these gaps promptly can strengthen understanding and improve future assessment performance.
Tracking Student Progress
The dashboard stores assessment results over time, allowing teachers to monitor individual and class-level growth. Educators can compare current results with earlier assessments to determine how performance has changed.
Using learning progress information helps reveal steady improvement, declining results, or students who may require additional assistance. Consistent monitoring supports timely interventions and more effective learning support.
Comparing Assessment Results
Teachers can compare results from quizzes, tests, and assignments to examine achievement and assess instructional effectiveness. Looking across multiple assessments can reveal performance patterns that may not appear in a single result.
Comparing assessment analytics can help educators determine which instructional approaches are producing progress and which topics need further reinforcement. It also provides a broader understanding of classroom achievement over time.
Making Data-Driven Decisions
Dashboard insights allow teachers to base instructional choices on actual assessment results rather than assumptions. This can support more focused lesson planning and more responsive classroom instruction.
By reviewing classroom analytics and student performance reports, educators can modify teaching approaches, plan targeted interventions, and provide more personalized learning support. Using assessment data effectively can strengthen engagement and contribute to sustained academic progress.
Exporting and Sharing Reports
The Pear Assessment Dashboard Guide makes it easier for educators to export, share, and print student performance reports. These options support collaboration, record-keeping, and instructional planning while keeping assessment information organized.
- Export to CSV: Download reports as CSV files to organize, sort, analyze, and manage assessment analytics efficiently with spreadsheet software.
- Export to PDF: Save performance reports as PDF documents for printing, sharing, archiving, or convenient review of assessment information.
- Share Reports with Administrators: Provide reports to administrators to review learning progress, discuss interventions, monitor achievement, and support collaborative instructional planning.
- Print Assessment Results: Print individual or class reports for parent meetings, classroom discussions, documentation, and effective review of classroom analytics.
Common Dashboard Problems and Solutions
The Pear Assessment Dashboard Guide provides practical ways to address common dashboard problems. Resolving issues involving student performance reports, assessment analytics, and account access can reduce interruptions and keep assessment workflows running smoothly.
Dashboard Not Loading
The dashboard may not load properly because of an unstable internet connection, an outdated browser, or temporary service issues. As a result, educators may be unable to access reports or assessment information.
Solution: Refresh the page, test your internet connection, clear the browser cache, update the browser, or use another supported browser. If the problem persists, wait briefly and attempt to access the dashboard again.
Missing Student Data
Student information may be missing when assessments have not been submitted, synchronized, or assigned properly. Synchronization delays can also prevent current information from appearing in performance reports.
Solution: Check that students completed and submitted the assessment, refresh the dashboard, confirm class assignments, and give the system time to synchronize the data. Contact your administrator if the information is still unavailable.
Reports Not Updating
Reports may take some time to reflect new assessment activity while data is being processed or if the dashboard has not refreshed. This can temporarily affect the availability of assessment analytics.
Solution: Refresh the dashboard, sign out and sign back in, confirm assessment completion, and check your internet connection. Reports should become available once the assessment data has finished processing.
Login Issues
Login difficulties may result from incorrect account credentials, an expired password, or browser-related problems. These issues can prevent access to dashboard reports and other features.
Solution: Check your email address and password, reset the password when required, clear browser cookies, or try another browser. Also confirm that your Pear Assessment account is active.
Slow Dashboard Performance
Dashboard performance can slow down when processing large volumes of assessment data, using an outdated browser, or keeping many browser tabs open simultaneously.
Solution: Close unnecessary tabs, update your browser, maintain a stable internet connection, clear cached files, and restart your browser or device to improve classroom analytics performance.
Pear Assessment Dashboard Tips for Teachers
The Pear Assessment Dashboard Guide helps teachers use assessment analytics more effectively while saving time, monitoring student performance, and strengthening classroom instruction. A consistent approach to reviewing dashboard information can make assessment data more useful and support improved learning outcomes.
Dashboard Tips for Teachers
- Save Time with Dashboard Filters: Apply class, date, and assessment filters to locate relevant reports quickly, minimize manual searching, and focus on the most important data.
- Monitor Struggling Students Early: Review student performance regularly to recognize learning gaps, offer timely assistance, and help prevent students from falling behind.
- Improve Classroom Instruction Using Analytics: Examine classroom analytics and learning progress to refine lesson plans, address weaker areas, and adapt instruction to student needs.
- Review Reports Consistently: Check assessment reports after each activity to follow progress, measure learning growth, and make informed, data-driven instructional decisions.
Frequently Asked Questions
What is the Pear Assessment Dashboard?
The Pear Assessment Dashboard helps teachers view student performance, analyze assessment results, monitor progress, and improve classroom instruction efficiently.
How do I access the Pear Assessment Dashboard?
Sign in to your Pear Assessment account, open the dashboard, and access assessment analytics, reports, classes, and student assessment data.
Can I export assessment reports?
Yes, you can export reports as CSV or PDF files for analysis, sharing, printing, and maintaining assessment records efficiently.
Why are my student scores missing?
Missing scores usually result from incomplete submissions, syncing delays, or incorrect class assignments. Refresh the dashboard and verify assessment completion.
How does dashboard analytics improve teaching?
Classroom analytics identify learning gaps, track progress, compare results, and help teachers make accurate, data-driven instructional decisions for better outcomes.
Conclusion
The Pear Assessment Dashboard Guide helps educators simplify assessment management by providing easy access to student performance, assessment analytics, and classroom reports. Its reporting tools and insights enable teachers to identify learning gaps, monitor progress, and make informed instructional decisions that improve student outcomes.
By using dashboard features consistently, educators can save time, track learning progress, and enhance classroom instruction with reliable data. Whether reviewing individual reports or analyzing class performance, the Pear Assessment Dashboard Guide supports more effective teaching and long-term student success.