
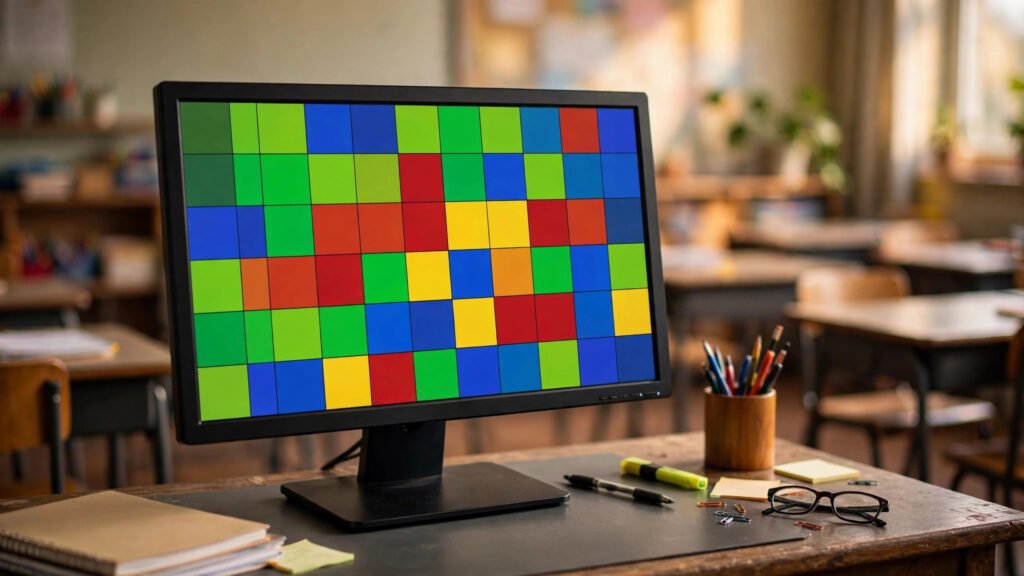
The live class board is the closest thing digital assessment has to reading a room. While a test runs, it shows every student’s progress and every answer as it lands — a grid of students against questions, colored by correctness — so you can see trouble forming at question six while the class is still on question nine, instead of discovering it in a report tomorrow. Used well, it turns testing time from supervision into teaching.
This guide teaches the board’s grammar: the layout, the famous colors (including what blue means), how to answer the two questions teachers ask it most, and how its companion reports — question analysis and response frequency — turn a finished test into next week’s lesson plan.
The board’s anatomy
Open an in-progress or finished assignment and the Live Class Board lays out your class as a matrix: rows are students, columns are questions, and each cell carries that student’s result on that question. Around the matrix sit the summary numbers — who has submitted, who is still working, class averages as they form. Cells update live as answers are submitted, which is what separates the board from every report that follows it: reports describe the past; the board is the present tense.
Read the board in three directions. Down a column (one question, all students) shows you the item’s health — a column bleeding red is a class-wide event. Across a row (one student, all questions) shows you an individual’s trajectory — strong start fading, or a late bloomer warming up. The whole grid’s texture shows the room: mostly green with scattered red is a healthy test; a wall of anything is a story. Teachers who glance at all three directions during a test develop an almost physical sense of how it is going, the digital version of watching faces over paper.
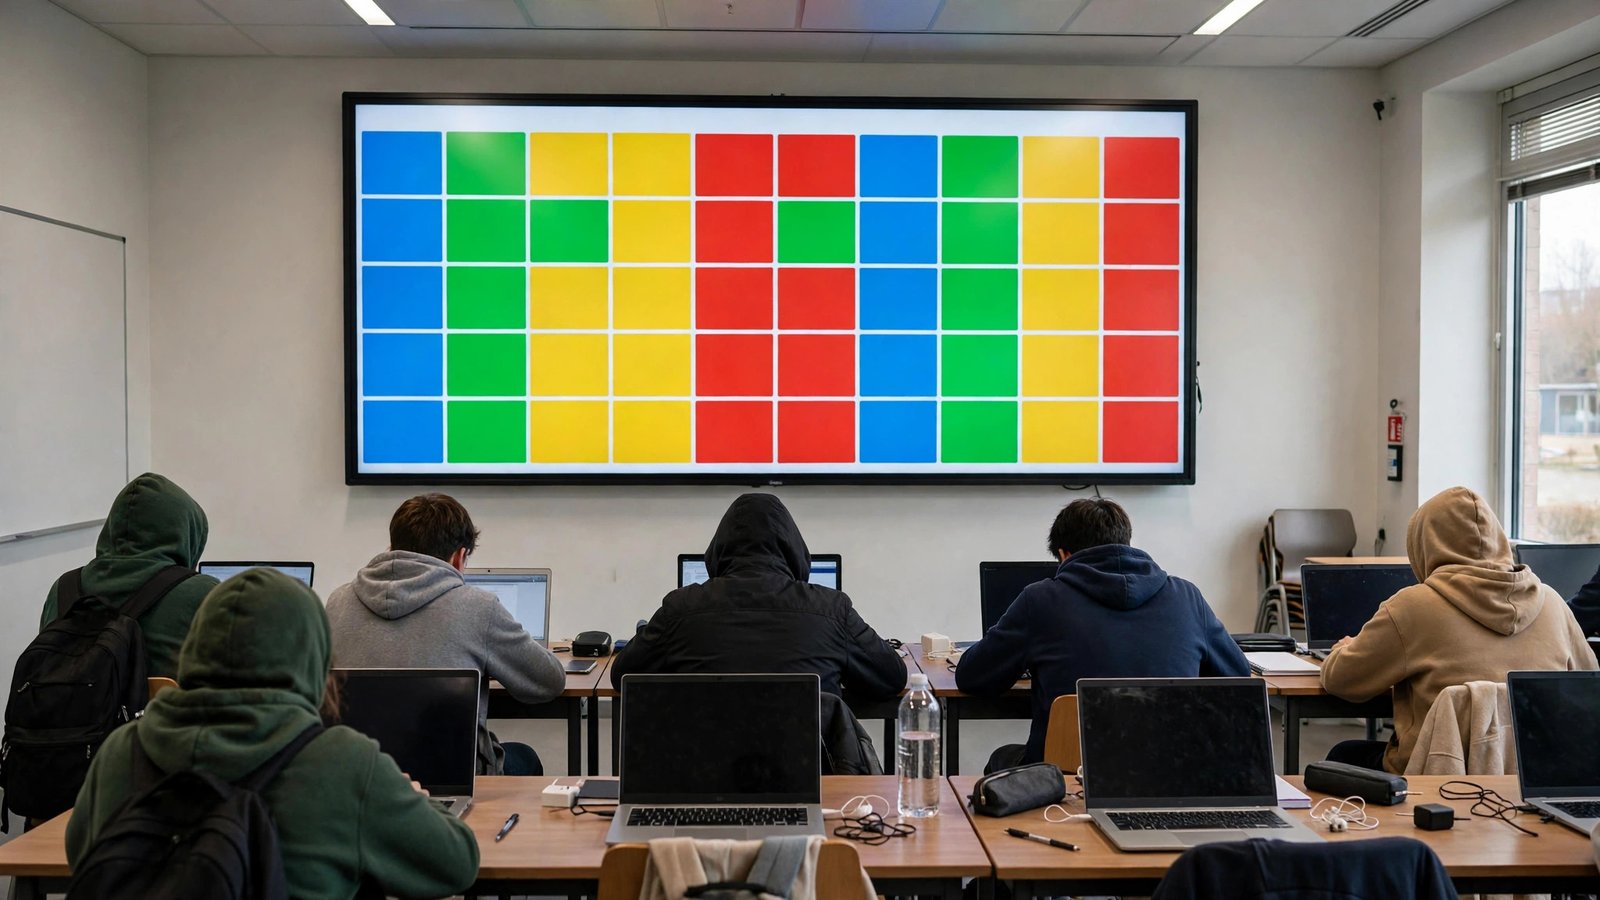
how are my students doing on this test in pear assessment
This is the board’s home question, and it answers at three altitudes. At the room altitude: the completion picture — how many are finished, how many are mid-test, who has not started — plus the forming class average tells you whether the test is calibrated or accidentally brutal. At the student altitude: rows flag the outliers live — the student finished in four minutes (rushing or guessing), the student stuck on one question for ten (frozen or lost), the reliable student whose row is inexplicably red (check on her first; something is off today, and it may not be fractions).
At the intervention altitude, the board licenses mid-test teaching moves that paper never allowed: pausing to clarify a genuinely ambiguous instruction the whole room is tripping on, quietly redirecting a stuck student to skip and return, or noting — not fixing, noting — the concept you will reteach tomorrow. What it does not license is hovering over individual answers to coach them; the board informs your teaching, not their answers. After submission, the same view feeds the deeper reports and, across the term, the long view in the student progress report.
which concepts are my students struggling with in pear assessment
The board answers this at the resolution of questions, and questions map to concepts through standards. A failing column is a clue, not a conclusion: open the item, confirm what it actually demands, and check whether its standard tag matches the concept you think failed. Three failure signatures are worth learning. One bad column among good ones: a single concept (or a single flawed item) — reteach the concept, void the item if it is broken. One standard’s columns bad across the test: the concept genuinely did not land; this is a reteach, not a review. Everything mildly red: the test was too hard, too long, or mistimed — a measurement problem wearing a learning problem’s clothes.
Carry the diagnosis one step further in the question analysis report (below), where the distractors tell you how the concept failed. “Struggling with equivalent fractions” is an observation; “choosing the option that adds denominators” is a lesson plan.
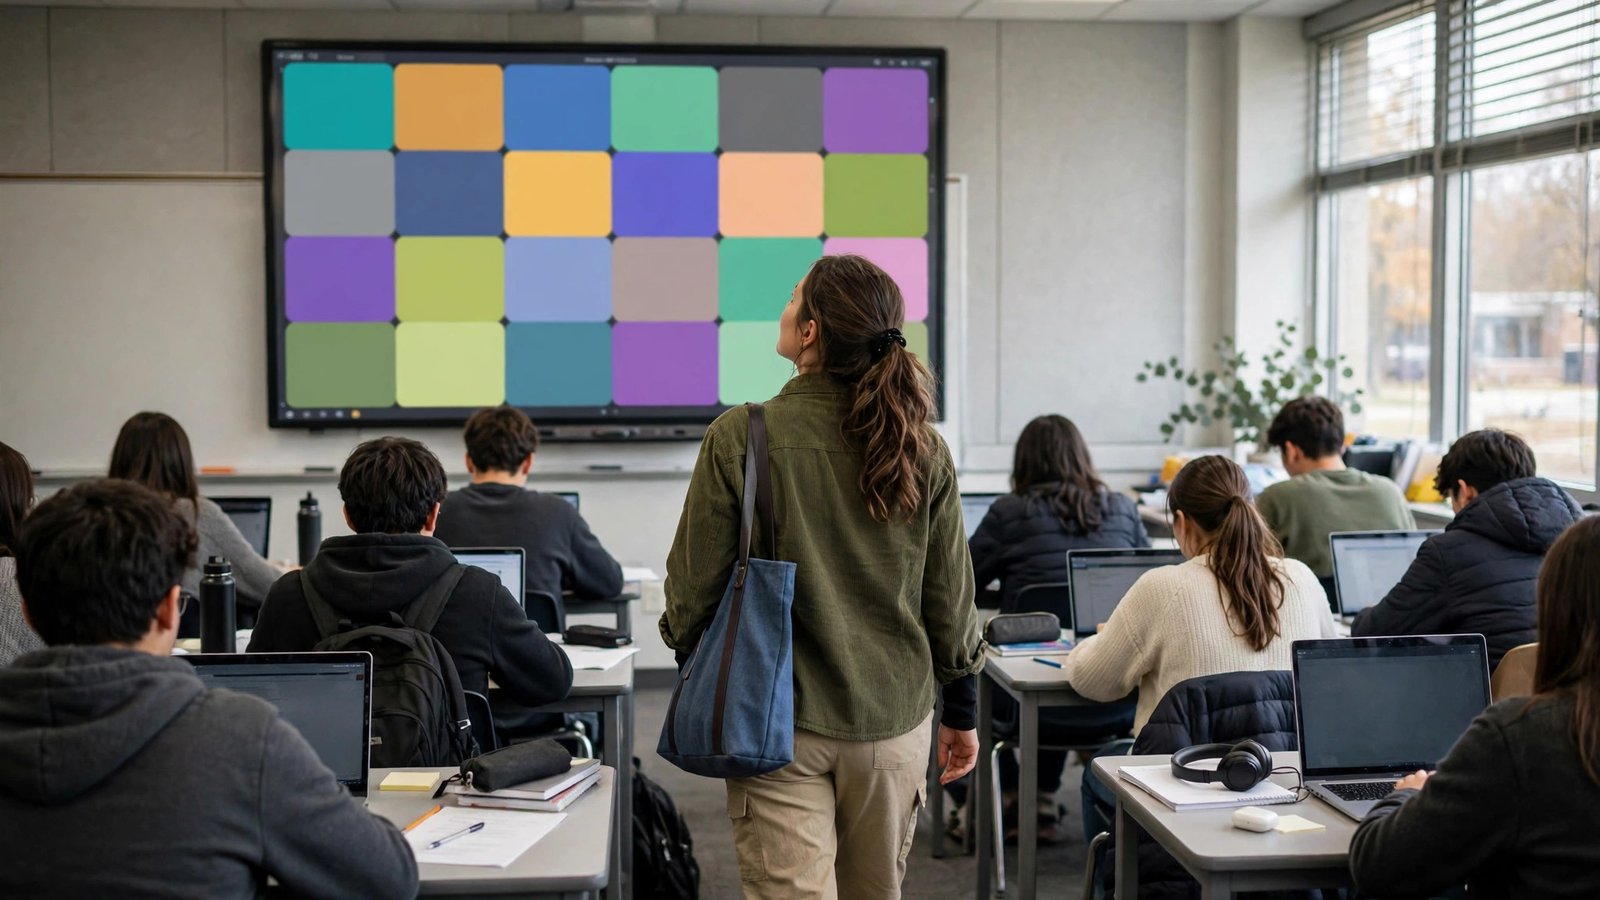
what does blue mean in edulastic
Edulastic is Pear Assessment’s former name, and the question survives from its era because the board’s colors survived with it. The legend, in the platform’s long-standing convention: green — correct; red — incorrect; yellow — partially correct (partial credit earned); grey — not yet answered or not submitted; and blue — the answer is in, but it is awaiting manual grading. Blue is the “teacher, this one’s yours” color: it marks responses the auto-grader cannot score — essays, short answers, work-showing items — sitting in your queue rather than in the results.
Knowing the legend prevents the two classic misreadings: mistaking a blue-heavy board for a failing class (it is usually just a test with writing on it), and mistaking a fully green-red board for a finished grading job (check for blue before you celebrate). Your manual grading workload, in other words, is visible at a glance — it is exactly the blue.
question analysis and response frequency reports in pear assessment
When the test closes, the Insights single-assessment reports take over from the board, and two of them deserve your routine attention. Question analysis works at item level: identify the most difficult questions, compare performance per question (including across classes), and — in the summary view’s Analysis tab — see average scores per question alongside time spent, a pairing that separates “hard” from “merely slow.” Response frequency diagnoses misunderstanding: it breaks performance down by question type and shows the frequently chosen answers, so you can see not just that students missed an item but which wrong answer seduced them.
Response frequency is the most underused diagnostic in the platform. A distractor chosen by half the class is a named misconception with an enrollment count — arguably the single most actionable datum a test can produce. Build the habit: after every significant assessment, list the top three seductive distractors and the misconception each encodes; that list is your reteach plan, written by your students. The official Insights assessment summary documentation walks through these tabs — Summary, Sub-Group, Analysis, Frequency, Standards, and Students — in the platform’s own words.
why are some questions still blue after auto grading in pear assessment
Because auto-grading has a jurisdiction. It scores what can be scored by rules: selected responses, numeric answers, matching, and the machine-checkable technology-enhanced types. Constructed responses — essays, explanations, short answers, anything scored against a rubric — are outside that jurisdiction by design, so they sit blue after the auto-grader has finished everything else. A test can therefore be simultaneously “auto-graded” and full of blue; both statements are true, and the blue residue is your manual queue.
Clearing it is a workflow, not a chore — and it is the subject of our companion guide to Express Grader in Pear Assessment, the grading view built to move through constructed responses quickly, question by question or student by student, with rubrics attached. Until blue is graded, treat every average on that assignment as provisional: the class score will move when the writing is counted, and releasing grades early invites exactly the confusion you would predict.
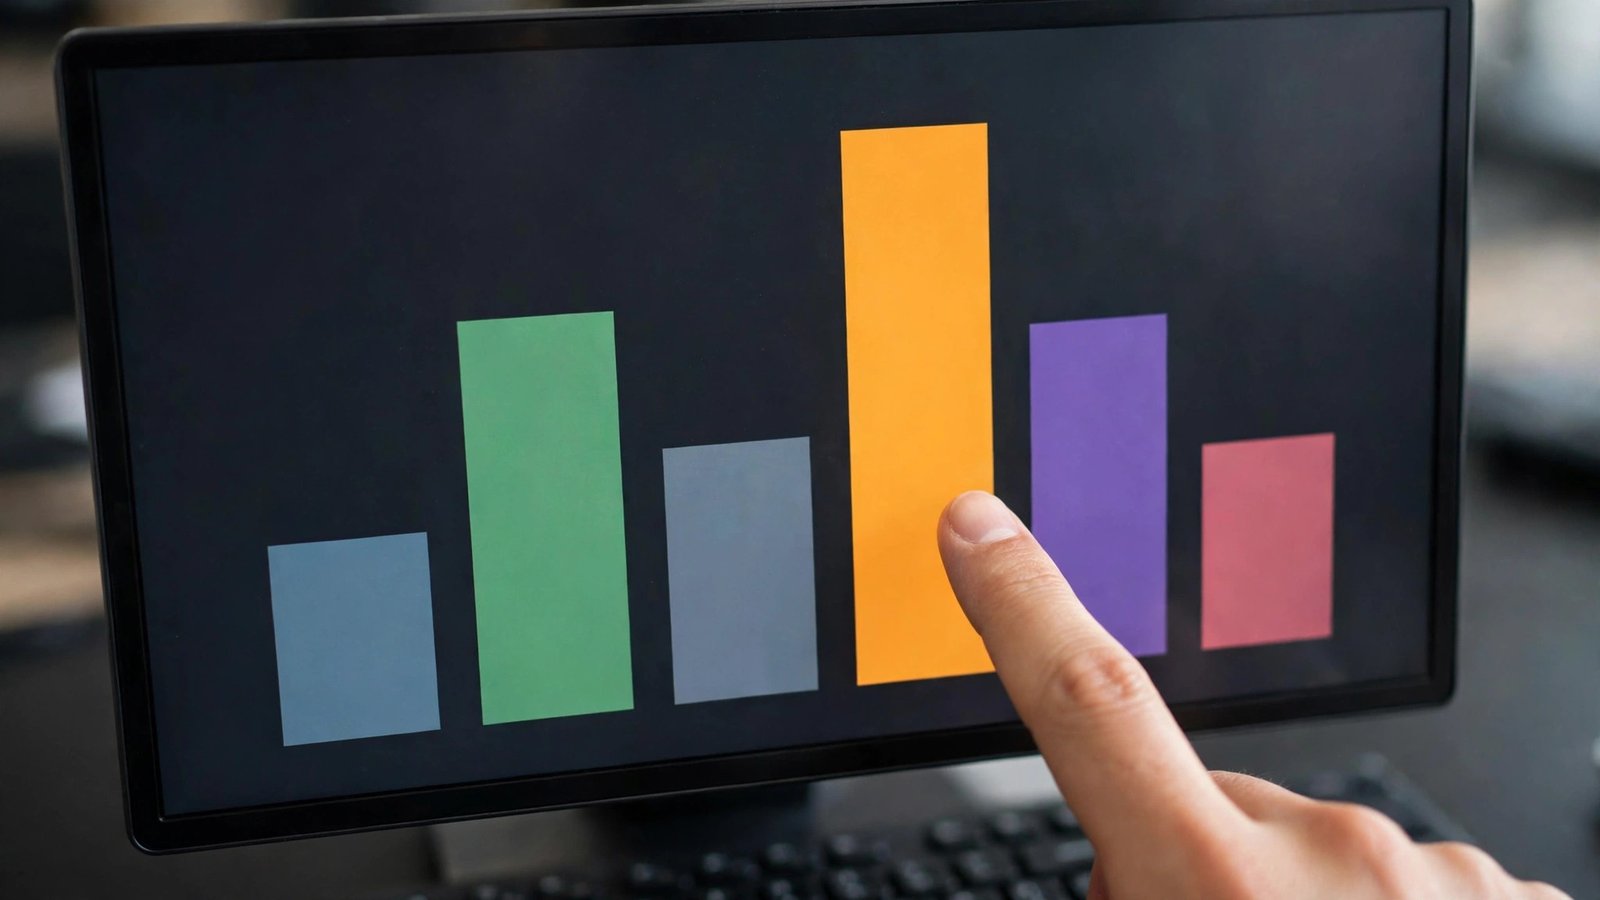
Board etiquette: never project it raw
A practical rule with legal undertones: do not put the live board on the classroom projector with names attached. Student performance data is education-record material, and a wall of named red cells is a public ranking no one consented to — demoralizing for the students at the bottom and a privacy problem in most districts’ policies besides. If you want the motivating effect of collective visibility (a class completion meter during a practice set), use aggregated or anonymized views: “eighteen of you are past question ten” gives the room energy without naming anyone’s row. What you glance at privately on your screen, and how you act on it quietly — a word with one student, a clarified instruction for all — is the board’s intended theater: informed teacher, unexposed students.
From board to gradebook: closing the loop on test day
Give finished tests a closing routine so board observations do not evaporate. In the ten minutes after a test closes: scan for blue and start (or schedule) the manual grading while the writing is fresh in your mind; screenshot-in-words the three loudest signals — the worst column, the seductive distractor, the outlier row — into your planner; and decide the one move tomorrow’s lesson makes because of them. Then let the deeper reports do their slower work overnight, and let the progress views accumulate this test into each student’s longer story.
The routine matters because the board’s data is perishable in a way reports are not. The reports will still tell you the numbers next week; they will not tell you that question six’s red column coincided with a fire drill, or that your strongest student’s red row was the day her glasses broke. Context is the teacher’s contribution to data, and test day is when you collect it.

FAQ
Can students see the live class board?
No — the board is a teacher view. Students see their own test and, according to your score-release settings, their own results. The board’s power depends on that privacy.
The board is not updating. What is wrong?
Usually a student device disconnected, a test left unsubmitted in another tab, or simple submission lag. Our Pear Assessment troubleshooting guide covers the connection and login culprits in order.
Can I print anything from the board?
Yes. From the Live Class Board you can print individual students’ completed assessments — showing their answers and scores — which is the fastest route to a paper copy for a conference or a student’s file. A fuller one-page performance record, the Student Report Card, is generated from the board area as a premium feature. Printing a whole class is rarely the best use of either; print for a purpose, per student, when paper is what the moment needs.
Should I act on board data mid-test or wait?
Act on logistics and clarity mid-test (stuck students, ambiguous instructions, technical issues); act on concepts after. The board tempts mid-test reteaching of content, which corrupts the measurement the reteach depends on.
Conclusion
The live class board rewards teachers who read it in three directions, respect its colors — green, red, yellow, grey, and the blue that quietly totals your grading queue — and hand its findings to question analysis and response frequency when the test closes. Together they form a loop: watch live, diagnose precisely, reteach by name. That loop, more than any single feature, is what digital assessment promised teaching in the first place. Learn the board’s grammar once, and every test you ever run on the platform starts talking to you in real time.