

A single test score is a photograph. The student progress report in Pear Assessment — part of the platform’s Insights reporting — is the film: it follows each student’s performance across assessments over time, letting you watch mastery accumulate, stall, or slide, standard by standard. Teachers who only open reports on test day are using a fraction of what they own; this report is built for the longitudinal questions that actually drive instruction: Is she growing? In what? Compared to which group? Since when?
This deep dive covers what the report shows, how to read growth over time, how to slice it by subgroup, how exports work, how to compare pre- and post-tests honestly, and how performance bands and grading scales shape everything the report displays.
What the Insights progress view shows
The report tracks students across the assessments they have taken and lets you view performance in the unit that suits your question: score percentage for a familiar overall picture that suits most everyday questions and conversations with families, raw points when assessments differ in length and percentages would mislead, or proficiency band when your school thinks in performance levels rather than numbers. Underneath, the standards-level view shows mastery per standard over time — the layer where instructional decisions actually live.
That unit choice matters more than it looks. Percentages hide denominator games (90% of ten easy points versus 90% of thirty hard ones); raw points hide scale differences between assessments; bands hide movement within a level. Professionals flip between views deliberately, the way a doctor reads both the chart and the trend line. If you are new to the platform’s reporting family as a whole, our overview of Pear Assessment reports maps the other views this one sits beside.
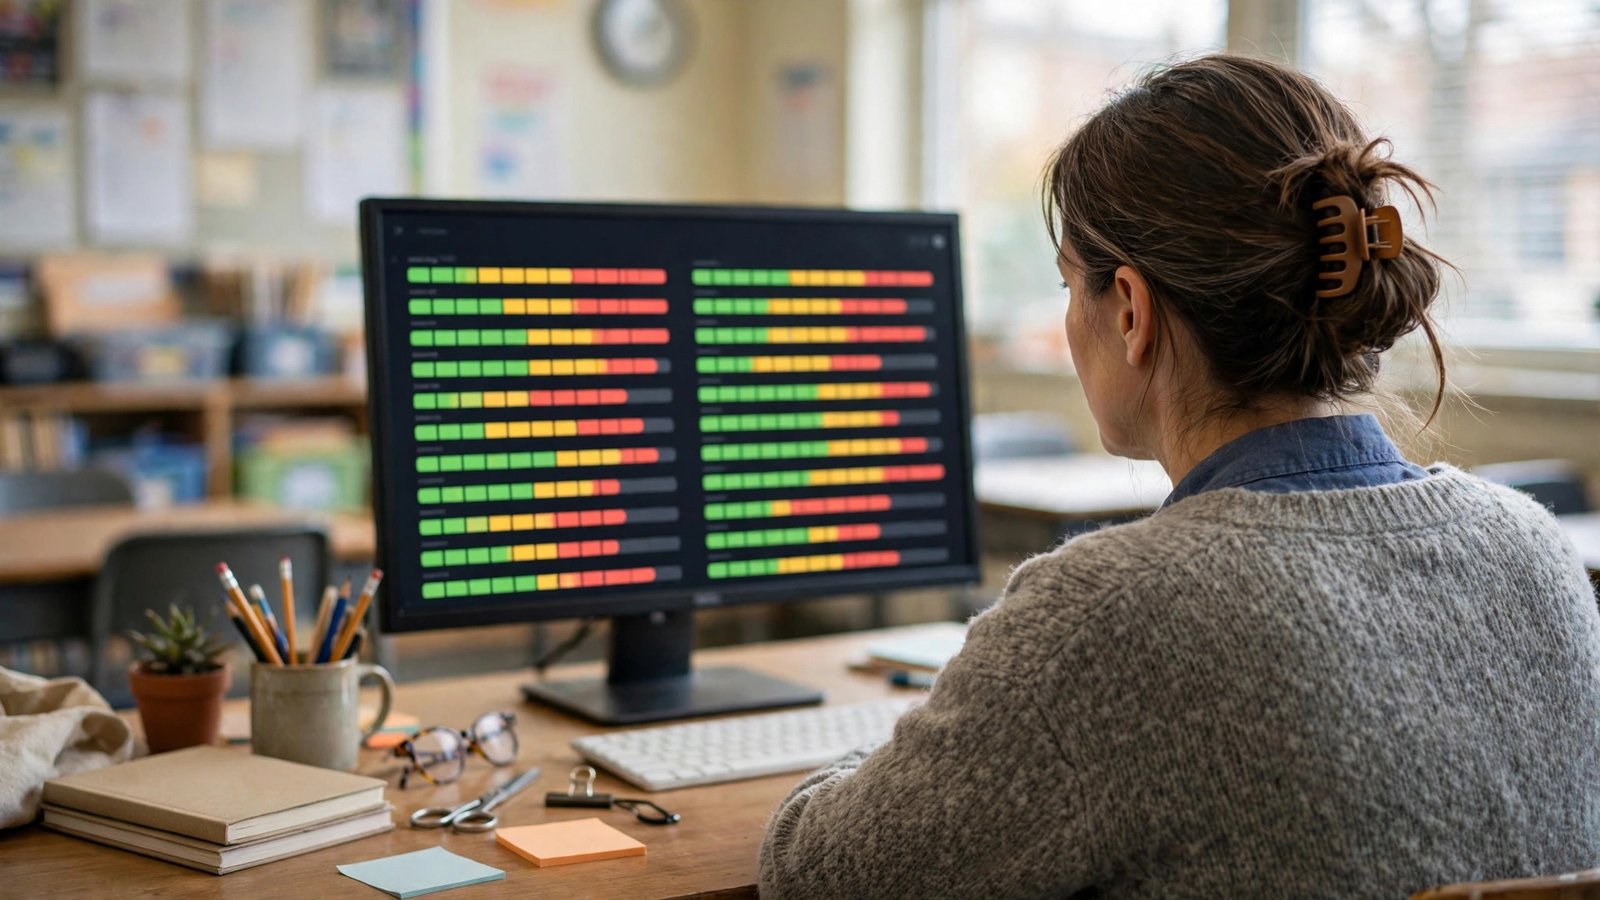
how can teachers use edulastic to track student progress over time
The question carries the platform’s former name — Edulastic is now Pear Assessment — and the habit it asks about is the report’s core purpose. Tracking progress over time works when three routines hold.
Tag everything to standards, always. Longitudinal data is only as good as its alignment: assessments tagged to standards accumulate into per-standard growth lines; untagged assessments are dead ends that the trend view cannot use. Check the trend, not the event. Open the progress view on a rhythm — every few weeks — rather than after every test; growth is a slope, and slopes need distance. Read declines as questions. A slide in one student’s line starts an inquiry (attendance? a missed unit? a standard that never landed?) rather than a conclusion, and the report’s per-assessment detail lets you walk the inquiry down to specific items in seconds.
Run those routines for a term and the report becomes your parent-conference and planning backbone: every claim about a student’s trajectory comes with a visible line and the assessments beneath it.
how to see how different subgroups of students performed in pear assessment
Equity questions need subgroup views, and the reporting supports slicing results for different groups of students — by class and student groupings — so you can compare how subgroups performed on the same assessment or standard. The practical workflow: filter the report to the assessment or standard in question, group the view, and compare distributions, not just averages. Two subgroups can share a mean while one is polarized (many thriving, many lost) and the other is uniformly middling; the band view exposes that difference instantly.
The report also closes the loop operationally: students identified in a view can be gathered into groups for follow-up — the germ of the workflow our guide to building intervention groups from Pear Assessment reports develops fully. Guardrails matter here. Subgroup data is for finding students who need more — more instruction, more time, more challenge — never for lowering expectations of a group as a class. And small subgroups produce noisy numbers; treat a four-student “trend” as a prompt to look at the four students, not as a statistic.

how to export pear assessment results to pdf or spreadsheet
Exports exist because reports live two lives: the working life inside the platform, and the shared life in meetings, conferences, and grade discussions. The reports support exporting results — including CSV/spreadsheet export for analysis — so you can take the data where it needs to go.
Choose the format by audience. A spreadsheet (CSV) is the analyst’s format: pivot it, merge it with attendance or prior-year data, build your own growth tables. If a question starts with “can we see whether…”, the answer is usually a spreadsheet and ten minutes. A PDF is the presenter’s format: fixed, printable, uneditable — right for a family conference handout, a PLC data wall, or documentation that should not silently change. Export with intent, and name files like records (2026-fall-fractions-progress.csv), because exported data has a way of outliving the meeting it was made for; handle student data files with the same care as any education record.
how to compare pre test and post test results in pear assessment
Pre/post comparison is the report’s most requested — and most abused — trick. Done properly: give a pre-test and a post-test that measure the same standards with comparable rigor (parallel forms, not the identical items, unless enough time has passed that memory is implausible), then compare in the progress view at the standards level. Growth shows as movement in score and, more readably, in proficiency bands per standard.
Done badly, it manufactures fiction: an easy post-test after a hard pre-test “proves” spectacular growth; the identical test re-given “proves” memorization. Two further honesty rules: compare the students who took both (mobility makes class averages lie), and expect — and say — that the largest jumps concentrate in the standards you actually retaught. A pre/post pair brackets a unit the way district benchmarks in Pear Assessment bracket a quarter; both are only as honest as the comparability of their two ends.
performance bands and standards based grading scales in pear assessment
Underneath every color in these reports sits a configuration choice. Performance bands are the proficiency levels into which scores are sorted — the familiar below/basic/proficient/advanced style ranges — and they are configured at the assignment level (you will find Performance Bands in the assign screen’s Miscellaneous settings), so a district or school can align band cut-offs with its own definitions. Standards-based grading scales similarly translate performance on standards into your school’s mastery scale, so the report can speak “meets standard” instead of only “82%”.
Configure these deliberately and document them, because bands change what every report means. The same student is “proficient” under one band set and “basic” under another; a PLC comparing classes assigned with different bands is comparing rulers, not students. Agree the bands as a team, keep them stable across the term, and treat mid-year band changes the way accountants treat restated earnings — sometimes necessary, always announced. The official reports overview in the GoGuardian documentation is the reference to keep open while you standardize your setup.

Reading one student’s line like a clinician
When a single student’s progress line concerns you, read it in passes. First pass, the shape: steadily rising, flat, falling, or sawtooth (strong on tests, weak on quizzes, or the reverse — each pattern suggests a different story, from test anxiety to homework copying). Second pass, the standards: is the weakness broad or concentrated in one strand that keeps recurring because everything later builds on it? Third pass, the artifacts: open the actual assessments under the worst points and look at the responses themselves. A progress line can tell you a student missed three fraction items; only the items tell you she adds denominators.
Then triangulate before concluding: attendance across the dip, work from other subjects, a two-minute conversation with the student. The report’s job is to start the right investigation sooner than instinct alone would have. Teachers who use it that way catch the quiet decliners in October instead of reading about them in January’s grades.
A monthly review ritual that takes twenty minutes
Longitudinal data pays only if someone looks at it longitudinally. A sustainable ritual: once a month, twenty minutes, three questions. Who moved? Scan the progress view for the biggest band changes in both directions; growers deserve the same curiosity as decliners, because whatever worked for them might be teachable. Which standard is the class’s story? One standard usually dominates the month’s data — name it, and decide its fate next month: reteach, spiral, or release. Who is on my watch list? Update a short named list — five to eight students whose lines you will check first next month — and write one line each about what you are trying for them.
Bring the same three questions to your PLC and the meeting improves instantly, because everyone is reading the same instrument the same way. The ritual is deliberately small; a monthly twenty minutes that happens beats a quarterly data day that everyone dreads and quietly routes around.
FAQ
How far back does the progress view reach?
It accumulates the assessments students take on the platform, so its history is as long as your usage — another reason to start standard-tagged assessing early in the year rather than at benchmark season.
Can families see this report?
The progress reporting is a teacher/school tool. For families, export a PDF snapshot and walk it through in conference; the narrative you add is what turns a chart into understanding.
What counts as “mastery” in these reports?
Mastery is a threshold, not a law of nature — typically a percentage or band level your school treats as “has it,” applied per standard. Because it is configurable, two schools’ mastery rates are not comparable until their thresholds are. Within your own building, agree the threshold once and hold it steady; a mastery definition that drifts mid-year makes every growth claim built on it suspect.
Why does a student’s band differ between two reports?
Usually because the underlying assessments used different band configurations, or because one view is standards-level and the other is overall-score. Check the assignment settings before suspecting the data.
Conclusion
The student progress report in Pear Assessment rewards teachers who treat it as a longitudinal instrument: consistently tagged assessments, the right unit for the question, subgroup views read for distribution rather than averages, exports chosen by audience, and pre/post comparisons kept honest. Set your performance bands once, as a team, and the colors start meaning the same thing in every room. Growth is the story every educator wants to tell; this is the report that lets you tell it with evidence. Open it this week, pick your watch list, and let next month’s twenty minutes surprise you with how much the lines have already started to say.