

A multiplication chart that works beautifully in second grade often flops in fifth grade. Same grid. Different needs. A chart meant for a beginner overwhelms an advanced learner. A chart meant for an older student confuses a younger one. Matching the chart to the right grade level makes all the difference.
Many teachers print the same multiplication charts for every student in the class. That approach seems fair on the surface. But different grades need different tools. Even within the same classroom, students sit at different places in their learning. This guide breaks down exactly which charts work best for each grade level and how to use them effectively.
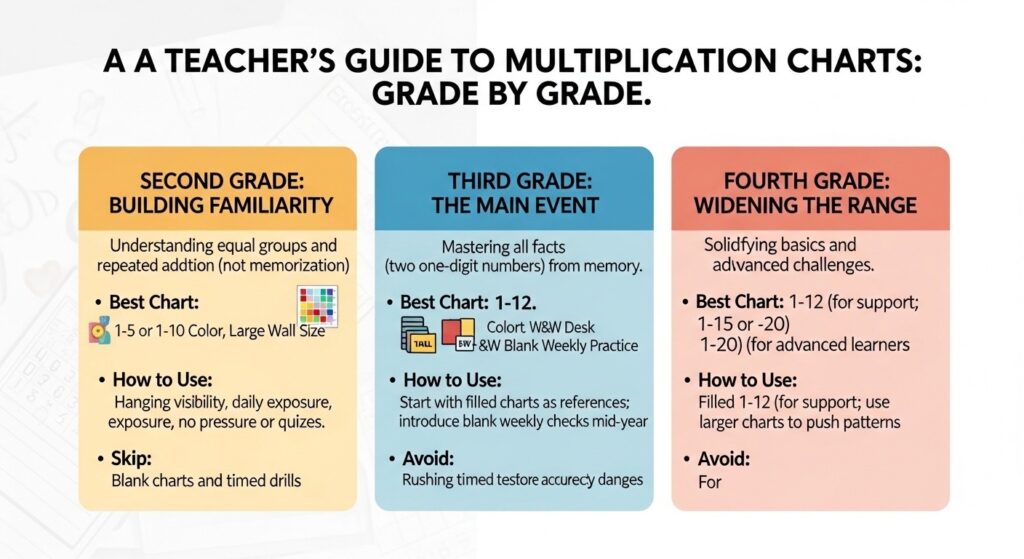
Second Grade: Just Getting Familiar
Second graders are not expected to memorize multiplication facts. The focus at this stage is on repeated addition, equal groups, and understanding what multiplication actually means. Memorization comes later.
Best chart choice:
1-5 or 1-10. Colour version. Large wall size.
Why this works:
Small grids prevent visual overload. Colour helps young eyes track rows and columns without getting lost. Large size means the chart can be seen from across the room.
How to use it:
Hang the chart somewhere visible. No drills. No quizzes. No pressure. The child sees the numbers daily during morning work, transitions, or math centres. Passive exposure builds familiarity. By the time third grade arrives, the chart already looks like an old friend.
What to skip:
Do not use blank charts at this stage. Do not time anything. Do not expect recall. Second grade is about planting seeds, not harvesting crops.
Third Grade: The Main Event
Third grade is when multiplication becomes a major focus. By the end of the year, students need to know all the products of two one-digit numbers from memory. That is a big ask for an eight-year-old.
Best chart choice:
1-12. Colour for the wall display. Black and white for desk copies. Blank version for weekly practice.
Why this works:
The 1-12 chart covers every fact tested in third grade. Colour helps visual learners spot patterns. Black and white saves ink when printing thirty copies.
How to use it:
Start the year with filled charts as reference tools. Let students look up answers during independent work. Around mid-year, introduce the blank chart. Use it as a Friday check-in. Five minutes to fill in what they know. The empty boxes show exactly which facts need work. Focus on practice there.
What to avoid:
Do not rush to timed tests before basic familiarity exists. A child who panics at the sight of a blank chart is not ready. Stick with the filled chart longer. Speed follows accuracy, not the other way around.
Fourth Grade: Widening the Range
Fourth graders should have the most basic facts down. Some do not. That is normal. The range of ability in a typical fourth-grade classroom is wide.
Best chart choice:
1-12 for students still mastering basics. 1-15 or 1-20 for students ready for a challenge.
Why this works:
The 1-12 chart remains useful as a safety net. The larger charts push advanced learners without introducing totally new concepts. The same patterns apply. Just more numbers.
How to use it:
For students still struggling, keep the 1-12 filled chart available. Use the blank version weekly. Pay attention to the 6s, 7s, and 8s. Those facts are usually the last to stick. For advanced students, hand them the 1-15 chart. Ask what patterns they notice. How is it similar to the 1-12 chart? How is it different?
What to avoid:
Do not force every student to move to a larger range. A fourth grader who does not know 7×8 automatically is not ready for 13×14. Master the basics first. Then expand.
Fifth Grade and Beyond: Patterns and Preparation
Fifth graders should have their multiplication facts down. If they do not, that becomes a real problem. Fractions, decimals, long division, and multi-digit multiplication all assume fluency with basic facts.
Best chart choice:
1-12 for quick review. 1-20 or 1-100 for pattern exploration.
Why this works:
The 1-12 chart works as a fast warm-up tool. The 1-20 chart prepares students for work with larger numbers. The 1-100 chart is excellent for spotting advanced patterns like prime numbers, square numbers, and factor pairs.
How to use it:
Use the blank 1-12 chart as a two-minute warm-up. Fill what fits. Check. Move on. For advanced students, give them the 1-100 chart. Ask them to shade all the prime numbers. Or find every perfect square. Or identify which products appear most often. That kind of exploration builds number sense that pays off in algebra.
What to avoid:
Do not assume every fifth grader has mastered the basics. Some still struggle. Give those students the 1-12 chart without shame. But also set a clear goal. By the end of the year, the training wheels need to come off.
Matching the Chart to the Student, Not Just the Grade
Grade level guidelines are just that – guidelines. Some third graders are ready for a 1-15 chart. Some fifth graders still need the 1-12 version. Pay attention to the individual student.
Signs a student needs a smaller chart:
Frustration, guessing, avoiding math time, taking forever to find basic facts.
Signs a student needs a larger chart:
Boredom, finishing blank charts too fast, asking for harder work, and mastering the current range with no errors.
The right chart meets the student where they are. Not where the curriculum says they should be. Not where the teacher wishes they were. Right where they are.
Quick Classroom Tips That Work
Wall display: Large chart laminated and hung where every student can see it from their seat. Colour for younger grades. Black and white works fine for older grades.
Desk copies: Small charts laminated and taped to the corner of each desk. Students can glance down without making a production of getting out a chart.
Take-home copies: Black and white charts sent home at the start of the multiplication unit. Parents appreciate having the same reference tool used in class.
Math centre: A stack of laminated blank charts and dry-erase markers. Students practice filling them in during free time or centre rotations.
Conclusion
A multiplication chart is not a one-size-fits-all tool. Second graders need small, colourful charts for gentle exposure. Third graders need the standard 1-12 chart for daily reference and weekly practice. Fourth graders need options, 1-12 for some, 1-15 for others. Fifth graders need review tools and pattern-spotting challenges.
Match the chart to the grade. Match the chart to the student. Use filled charts for reference. Use blank charts for practice. Hang charts where everyone can see them. Send copies home. Meet each student where they are. That simple approach turns a basic grid into something genuinely useful.